Make database queries visible 
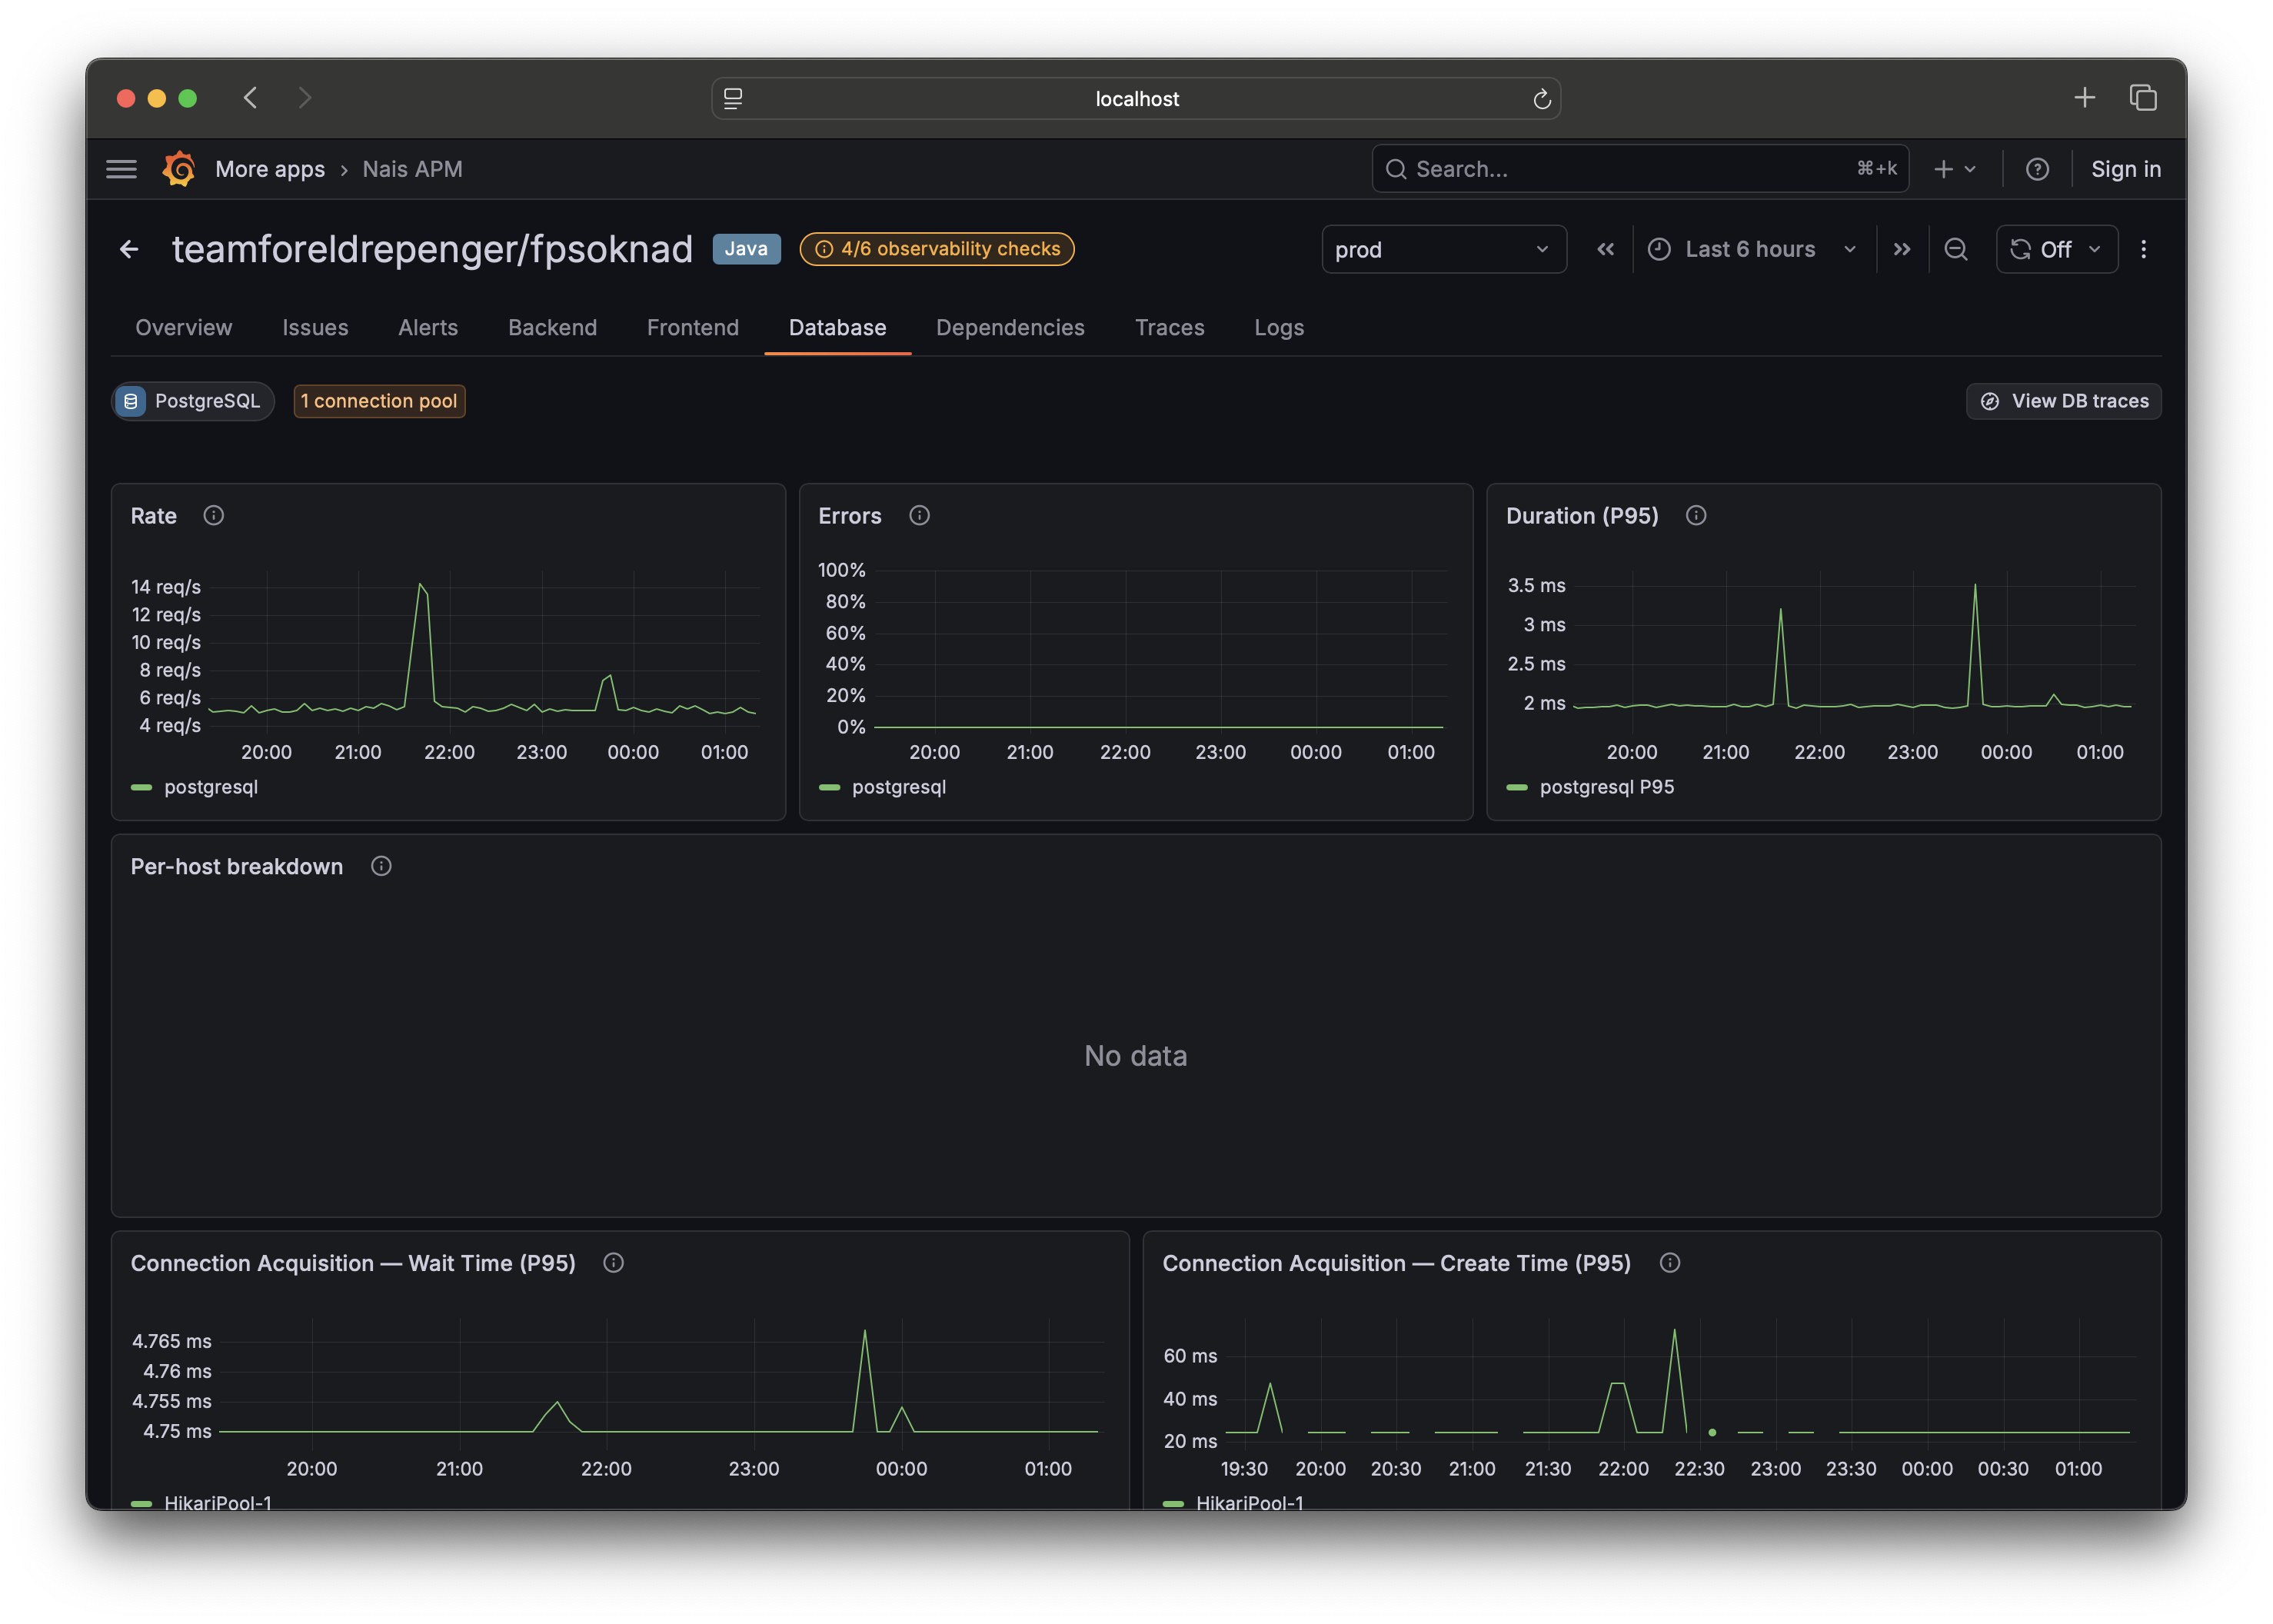
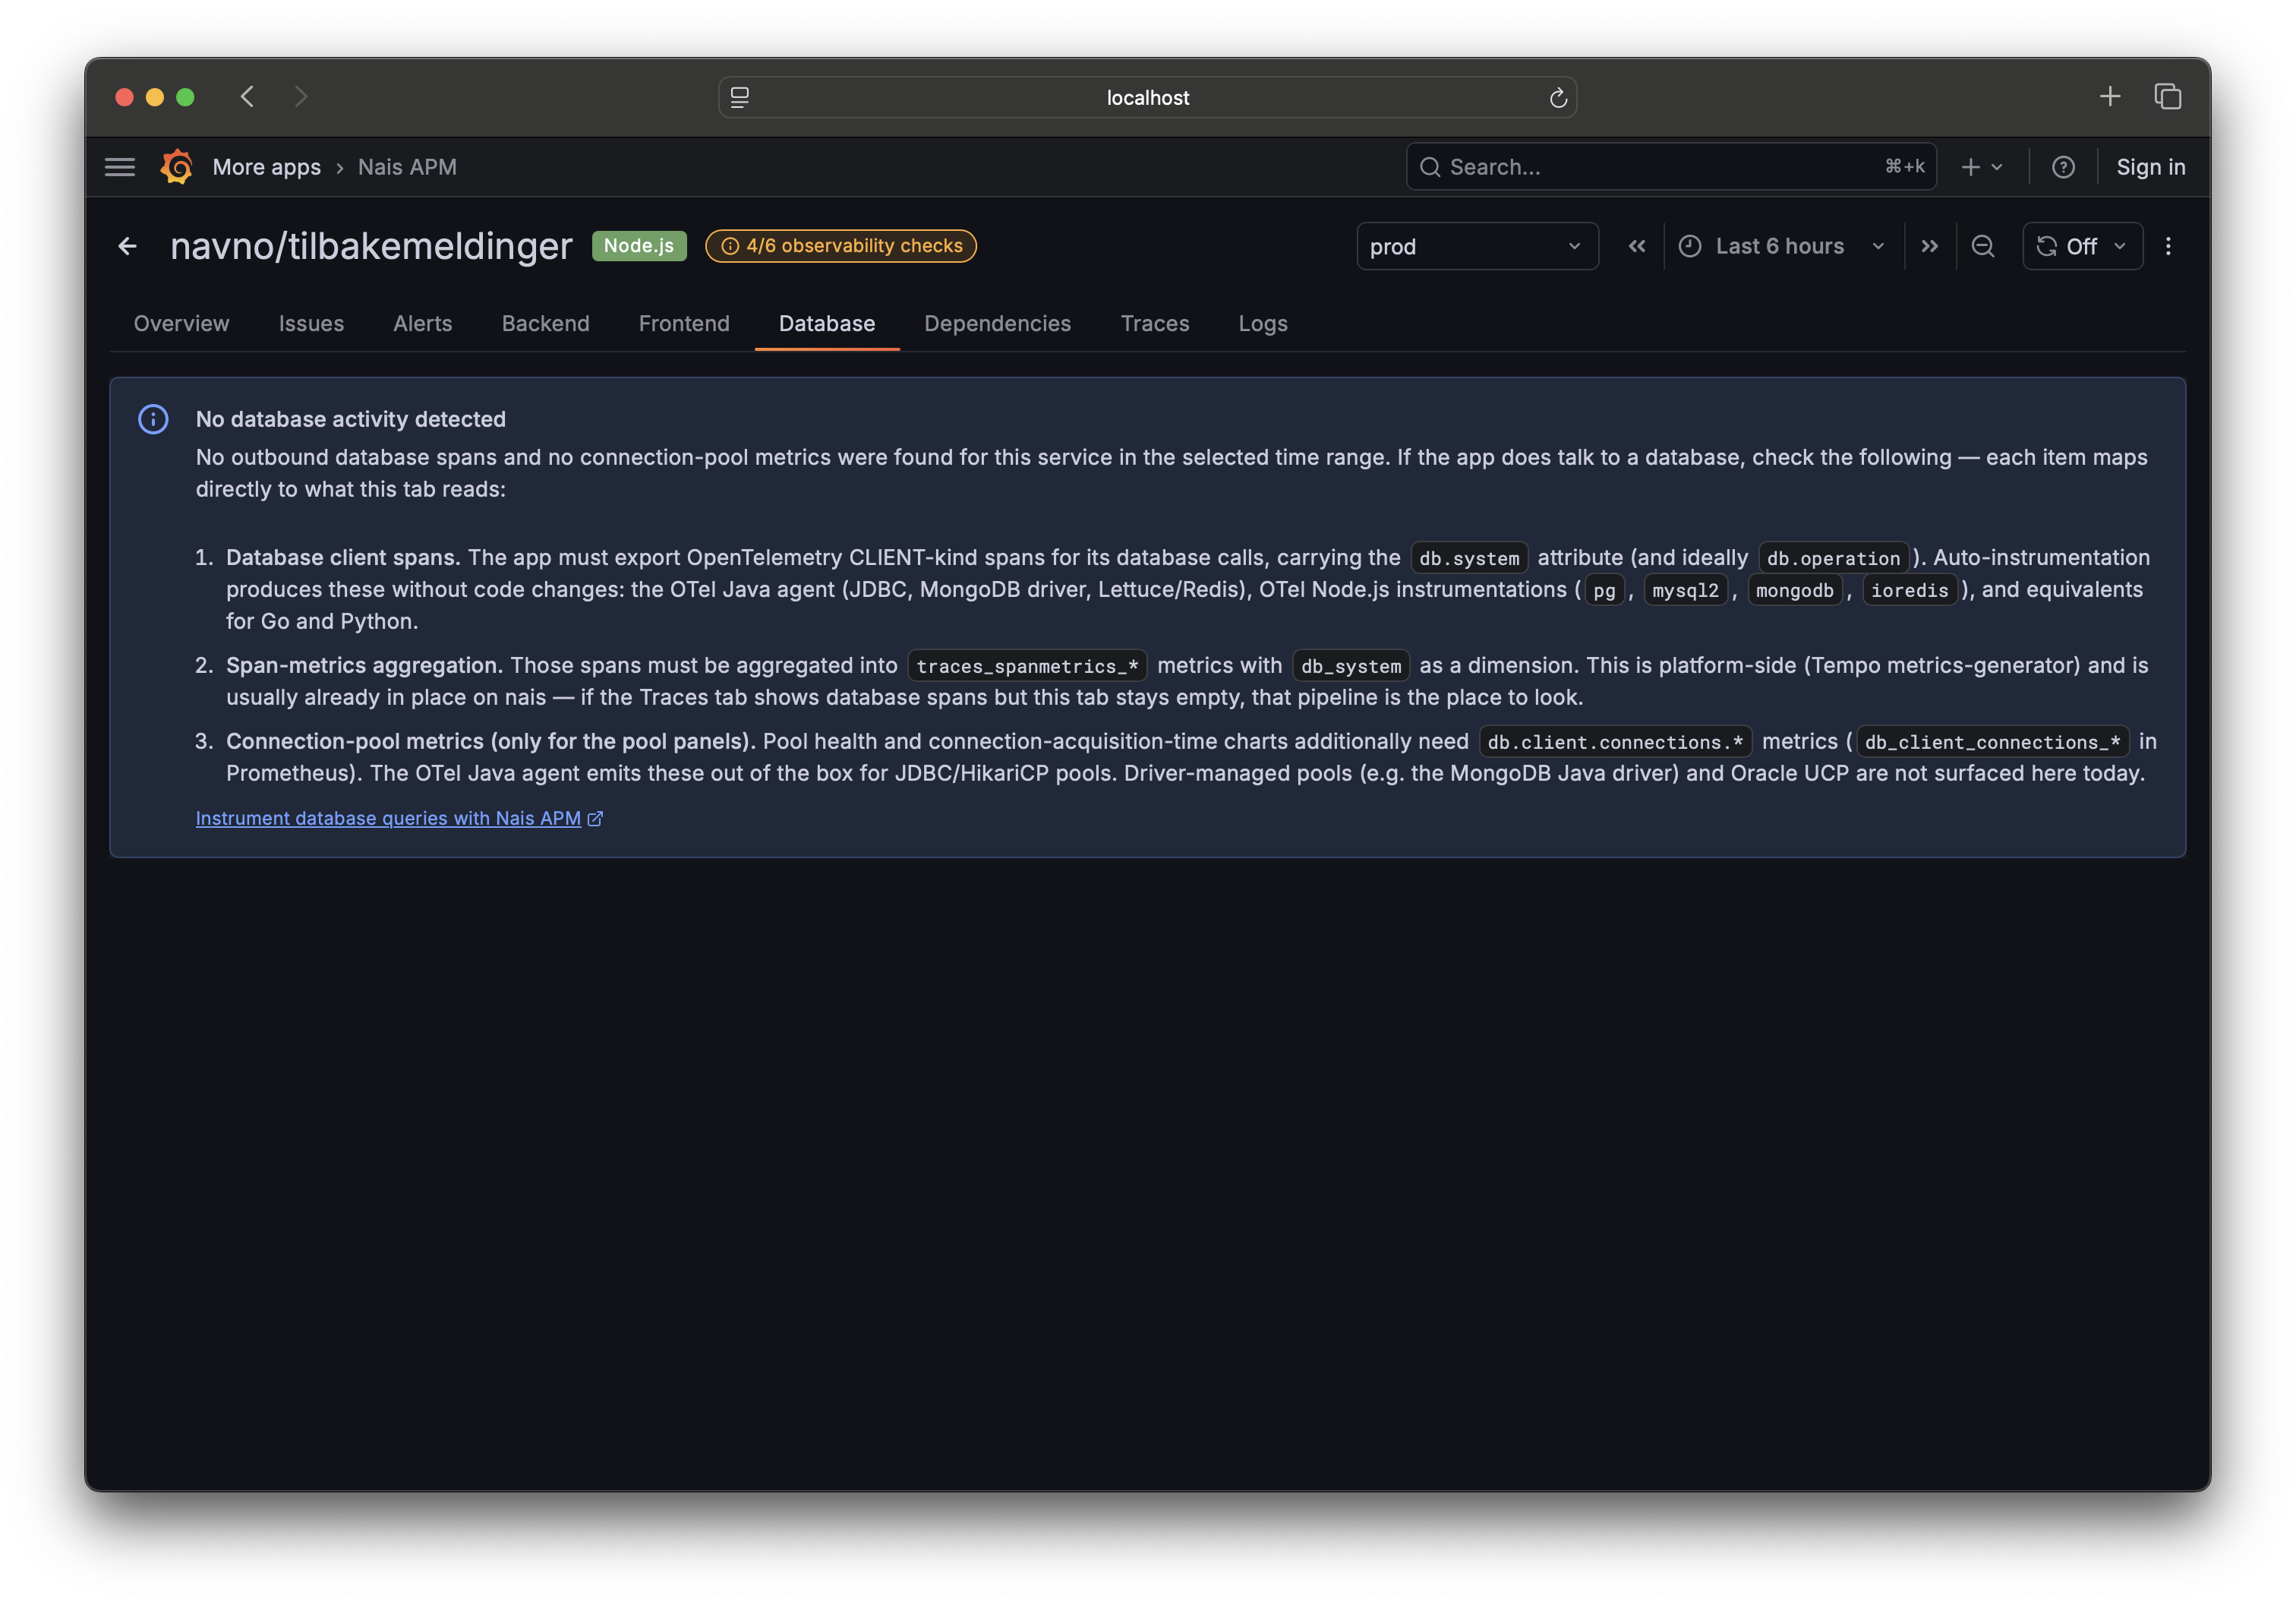
The Database tab shows which database systems your service talks to, RED metrics per operation (rate, errors, latency), and connection-pool health. It's built entirely from telemetry your app emits — if the tab is empty, this is the checklist to work through. Each item maps directly to what the tab reads.
Requirements checklist 
1. Database client spans 
Your app must export OpenTelemetry CLIENT-kind spans for its database calls,
carrying the db.system attribute (and ideally db.operation).
Auto-instrumentation produces these without code changes:
- the OTel Java agent (JDBC, the MongoDB driver, Lettuce/Redis);
- OTel Node.js instrumentations (
pg,mysql2,mongodb,ioredis); - equivalents for Go and Python.
If your service already appears on the Traces tab with database spans, this part is done.
The platform turns those spans into the per-operation metrics the tab reads — you don't configure that. If the Traces tab shows database spans but the Database tab stays empty, it's a platform-side gap rather than anything in your app; ask on #nais.
2. Connection-pool metrics (for the pool panels only) 
Pool health and connection-acquisition-time charts additionally need
db.client.connections.* metrics (db_client_connections_* in Prometheus).
The OTel Java agent emits these out of the box for JDBC/HikariCP pools. Driver-managed pools (for example the MongoDB Java driver) and Oracle UCP are not surfaced here today.
What you'll see when it's partially instrumented 
| You have | You see |
|---|---|
| Spans and pool metrics | Full Database tab — query analytics and pool health |
| Spans but no pool metrics | Query analytics; a note that pool metrics aren't detected |
| Pool metrics but no spans | Pool panels; a note that database spans aren't detected |
| Neither | The full requirements checklist above |
Related 
- Automatic observability — how Nais injects OpenTelemetry agents.