Create alerts in nav-logs (OpenSearch Dashboards) 
This guide will help you create alerts based on your application logs in nav-logs (OpenSearch Dashboards).
Alerting in OpenSearch consists of two main components: notification channels (where alerts are sent) and monitors (what triggers the alerts). You must create a notification channel before you can create a monitor.
Prerequisites 
- You have enabled logging to nav-logs for your application
- You have access to nav-logs
- You have a Slack webhook URL ready (see Step 1 below)
Step 1: Create a notification channel 
Before you can receive alerts, you need to create a notification channel. This defines where your alerts will be sent.
Access notification channels 
- Navigate to logs.az.nav.no
- Open the menu and navigate to Notifications → Channels
- Or go directly to the Channels page
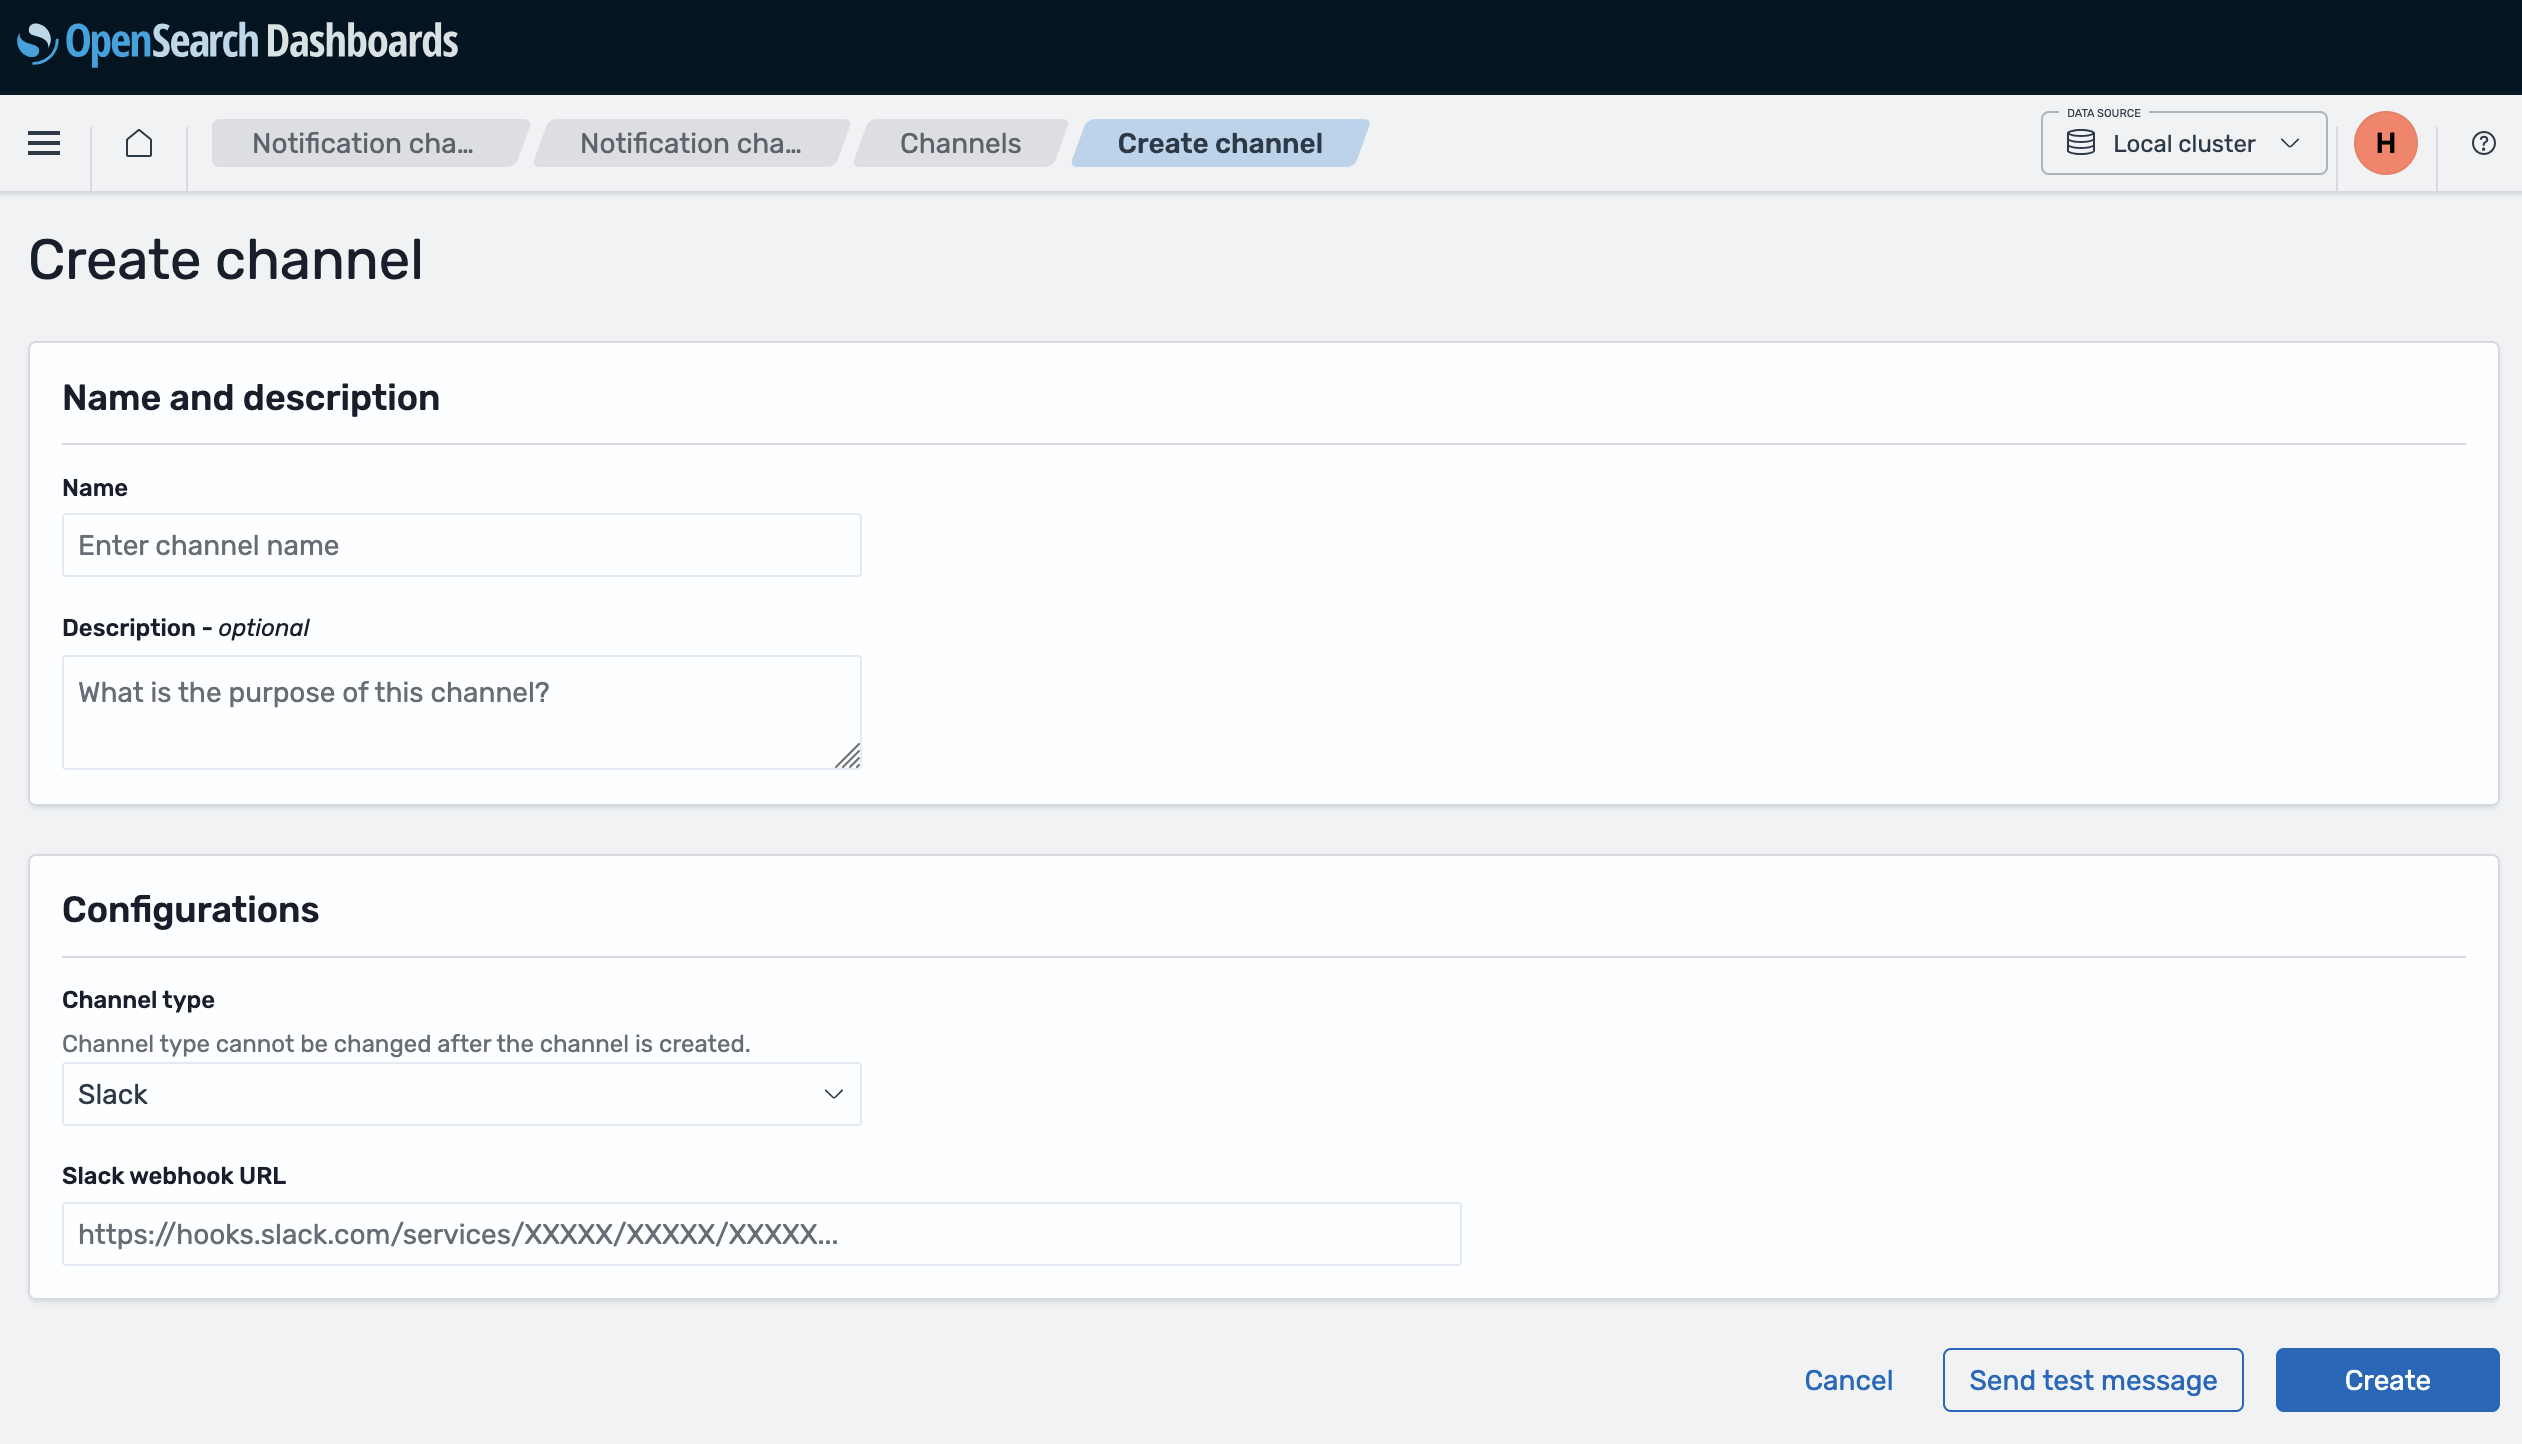
Create a new channel 
- Click Create channel
- Name: Give your channel a descriptive name (e.g., "my-team-slack-alerts")
- Channel type: Select Slack
- Slack webhook URL: Paste your Slack incoming webhook URL
- To create a webhook: Go to your Slack workspace → Apps → Incoming Webhooks
- Configure which channel receives notifications and copy the webhook URL
- Click Create
Step 2: Create a monitor 
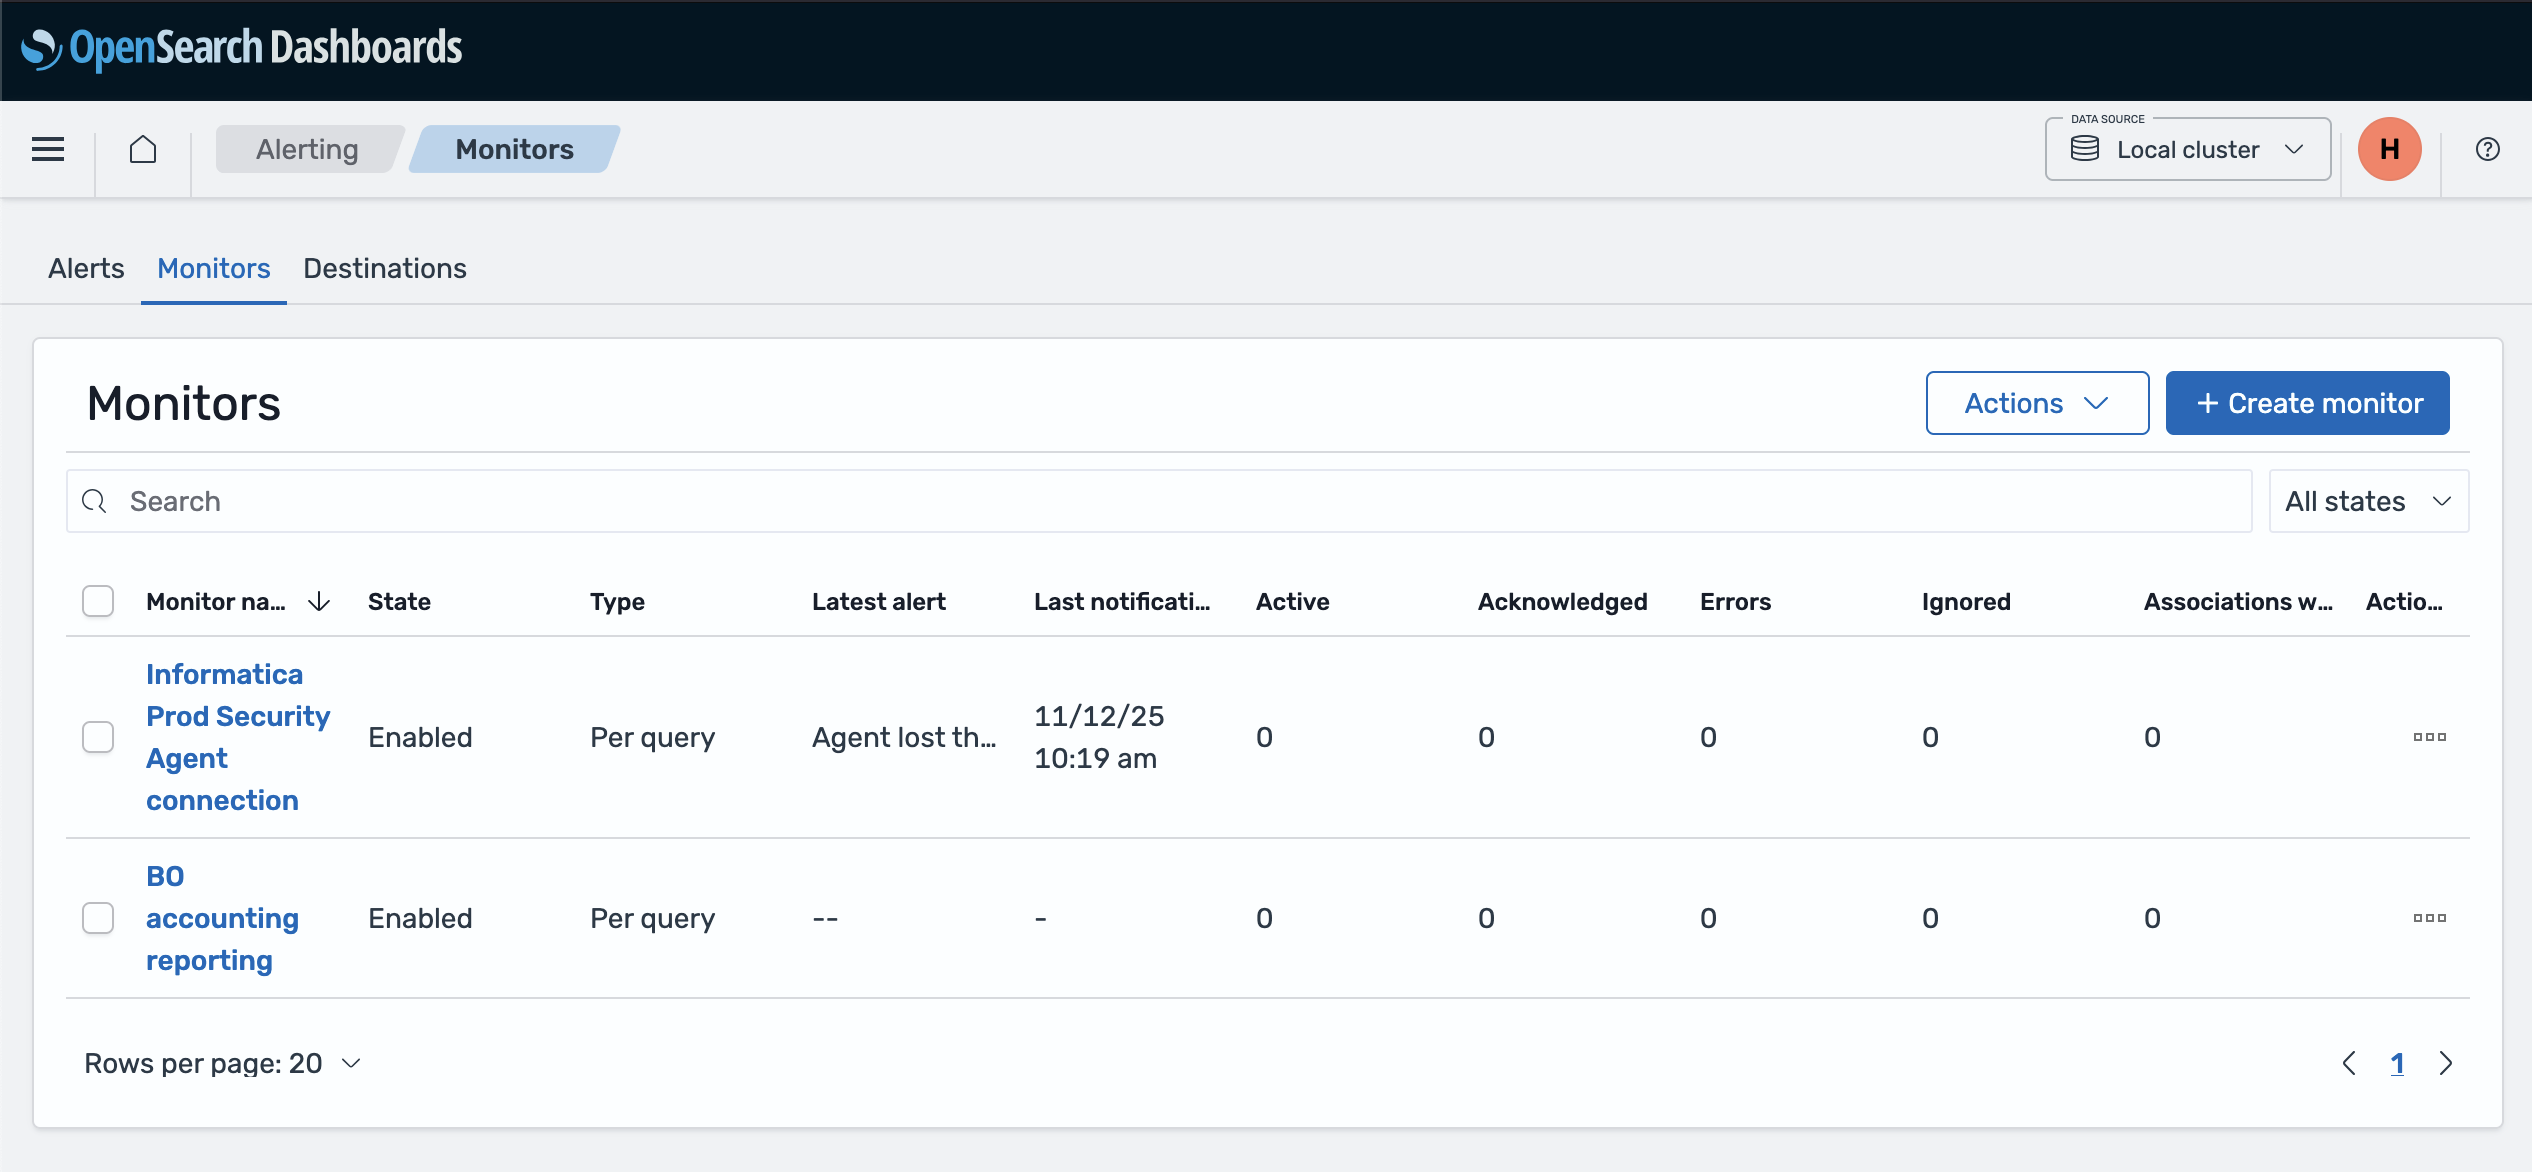
Monitors run queries on your logs at scheduled intervals and trigger alerts when conditions are met.
Access monitors 
- Go directly to the Create monitor page
- Or navigate from the menu: Alerting → Monitors → Create monitor
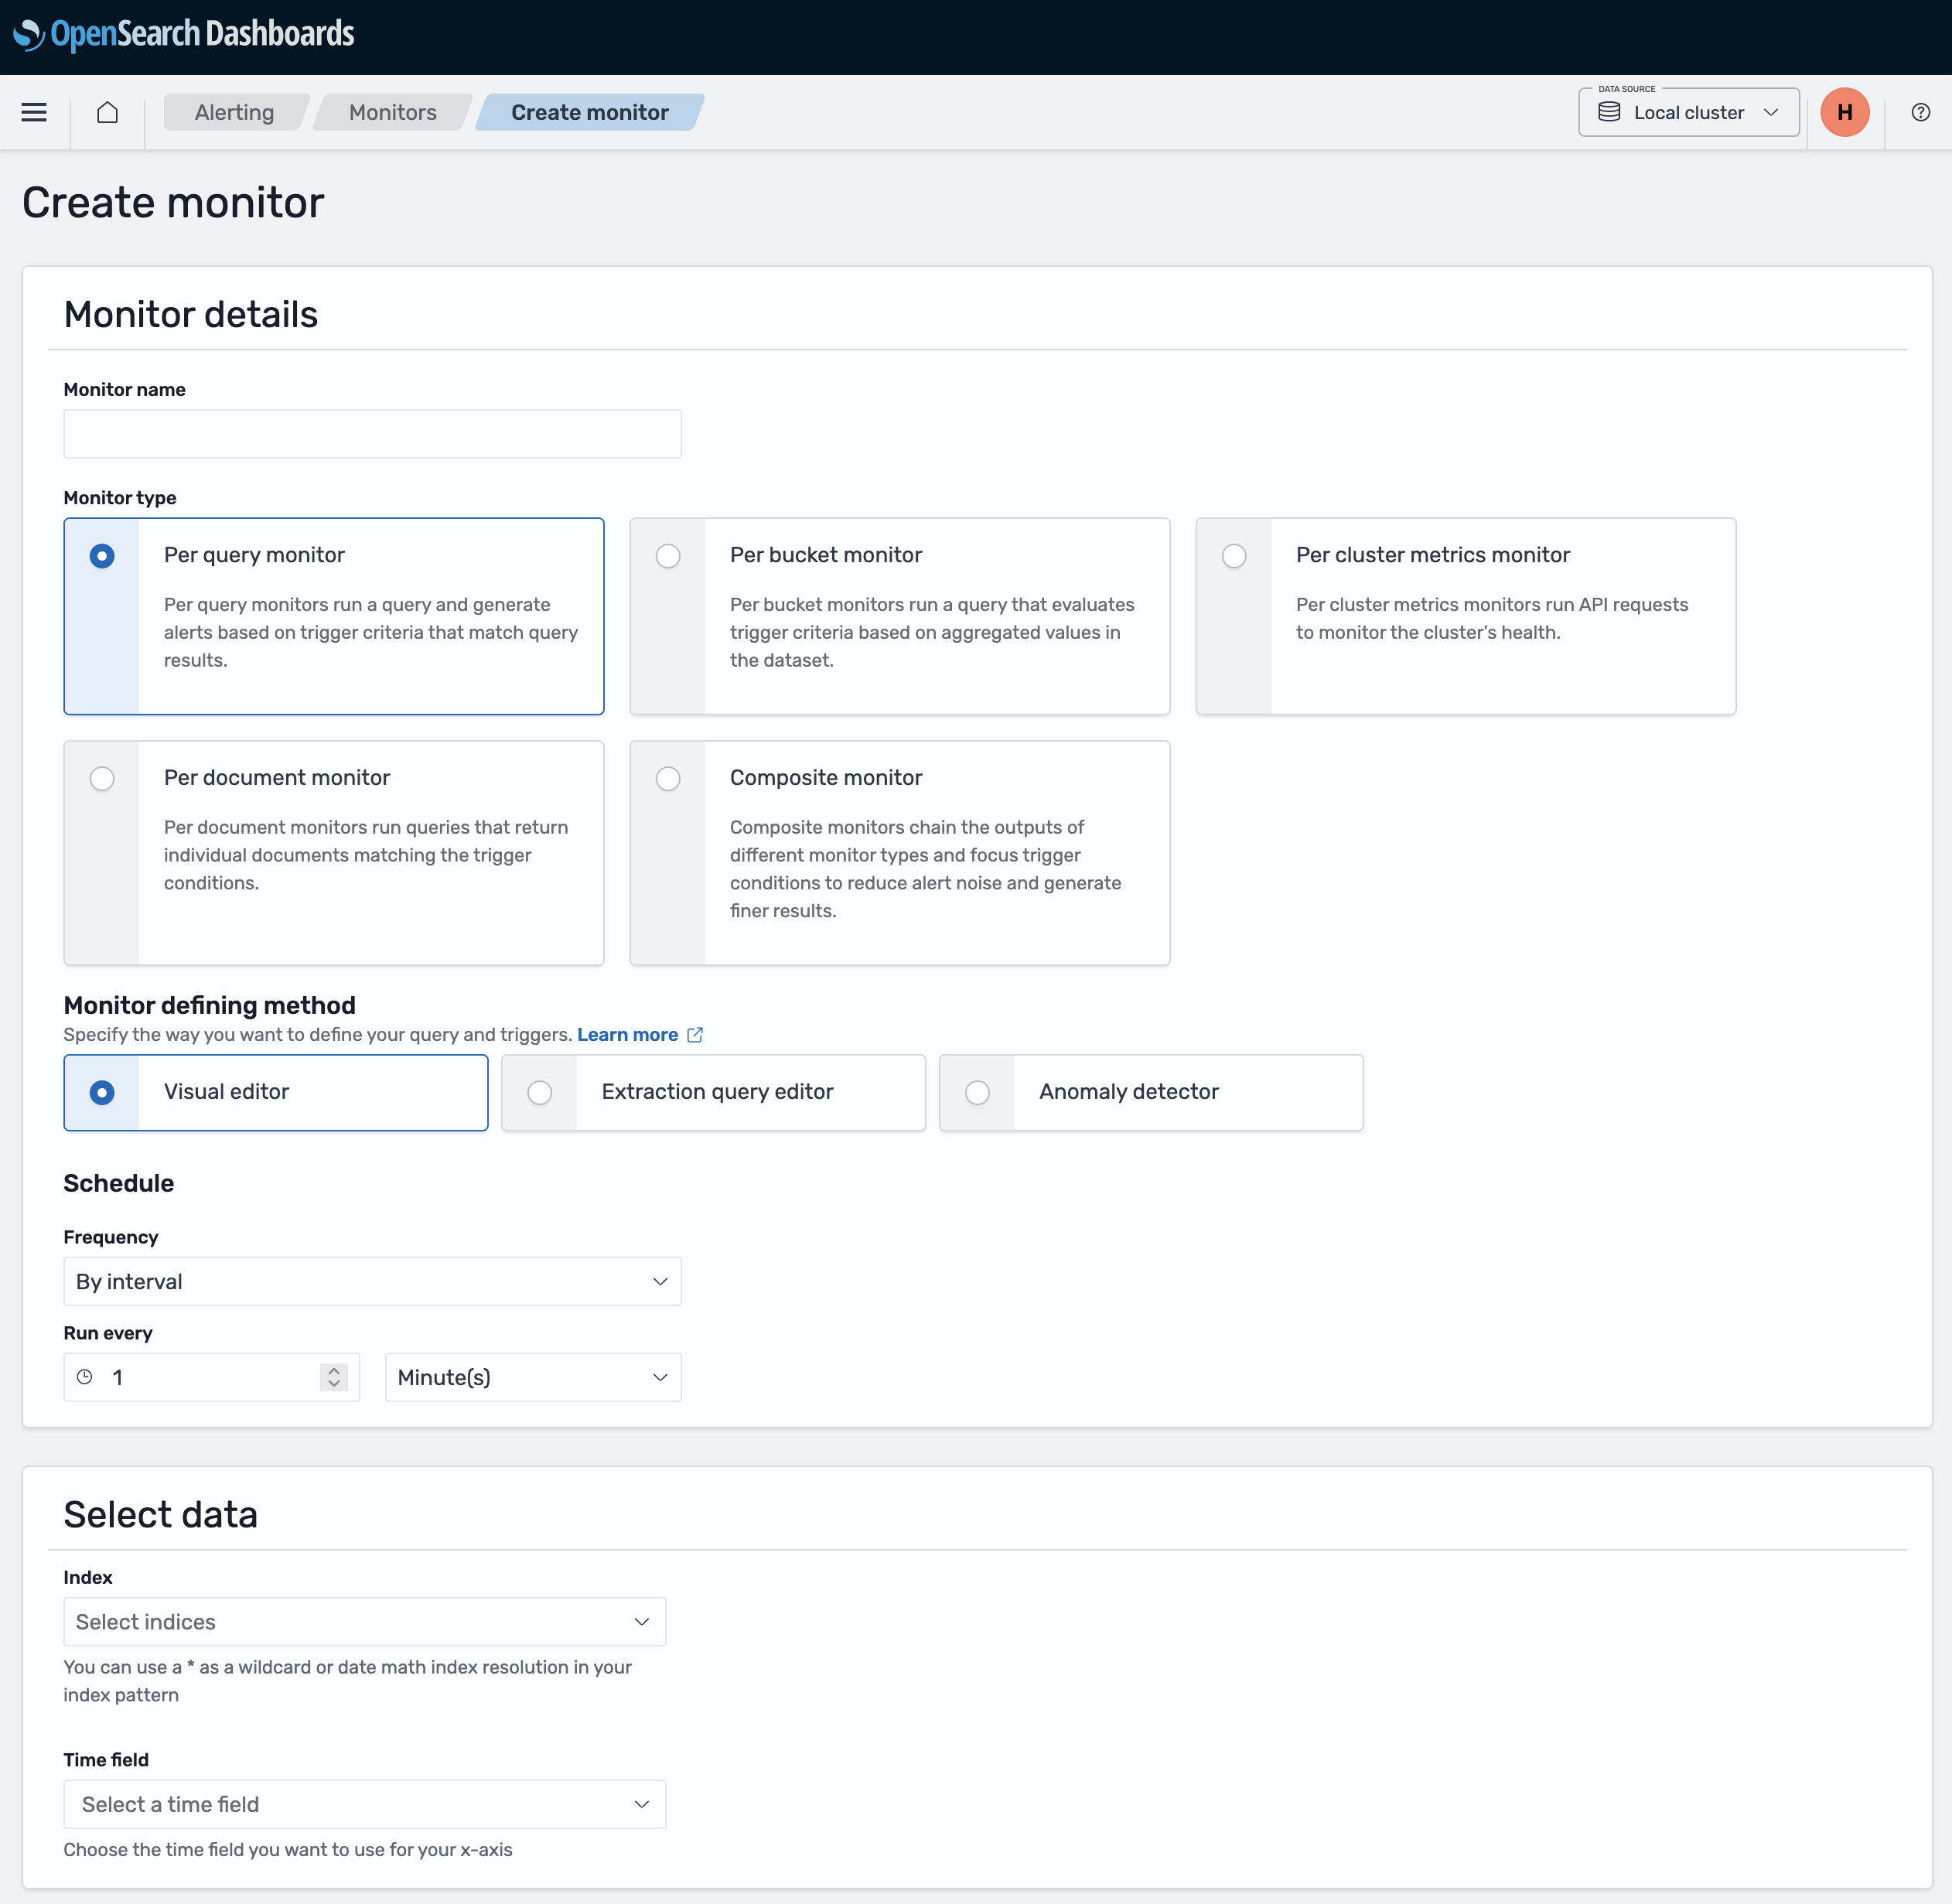
Configure monitor basics 
- Monitor name: Give your monitor a descriptive name (e.g., "BO accounting reporting")
- Monitor type: Select Per query monitor (this is what you're familiar with from logs.adeo.no)
- Schedule: Set how often to check (e.g., every 5 minutes)
Define what to monitor 
- Index: Enter the data stream name or pattern:
logs.nais- Nais application logslogs.aura- Aura database logslogs.datapower- DataPower logslogs*- All log types (supports current and future data streams)
- Time field: Select
@timestamp
Define your query 
You can define your query using one of two methods:
Method 1: Visual editor 
Use the visual editor to build your query with filters:
Query examples:
application: "my-app" AND level: "ERROR"
application: "my-app" AND message: "Database connection failed"
namespace: "myteam" AND level: "ERROR"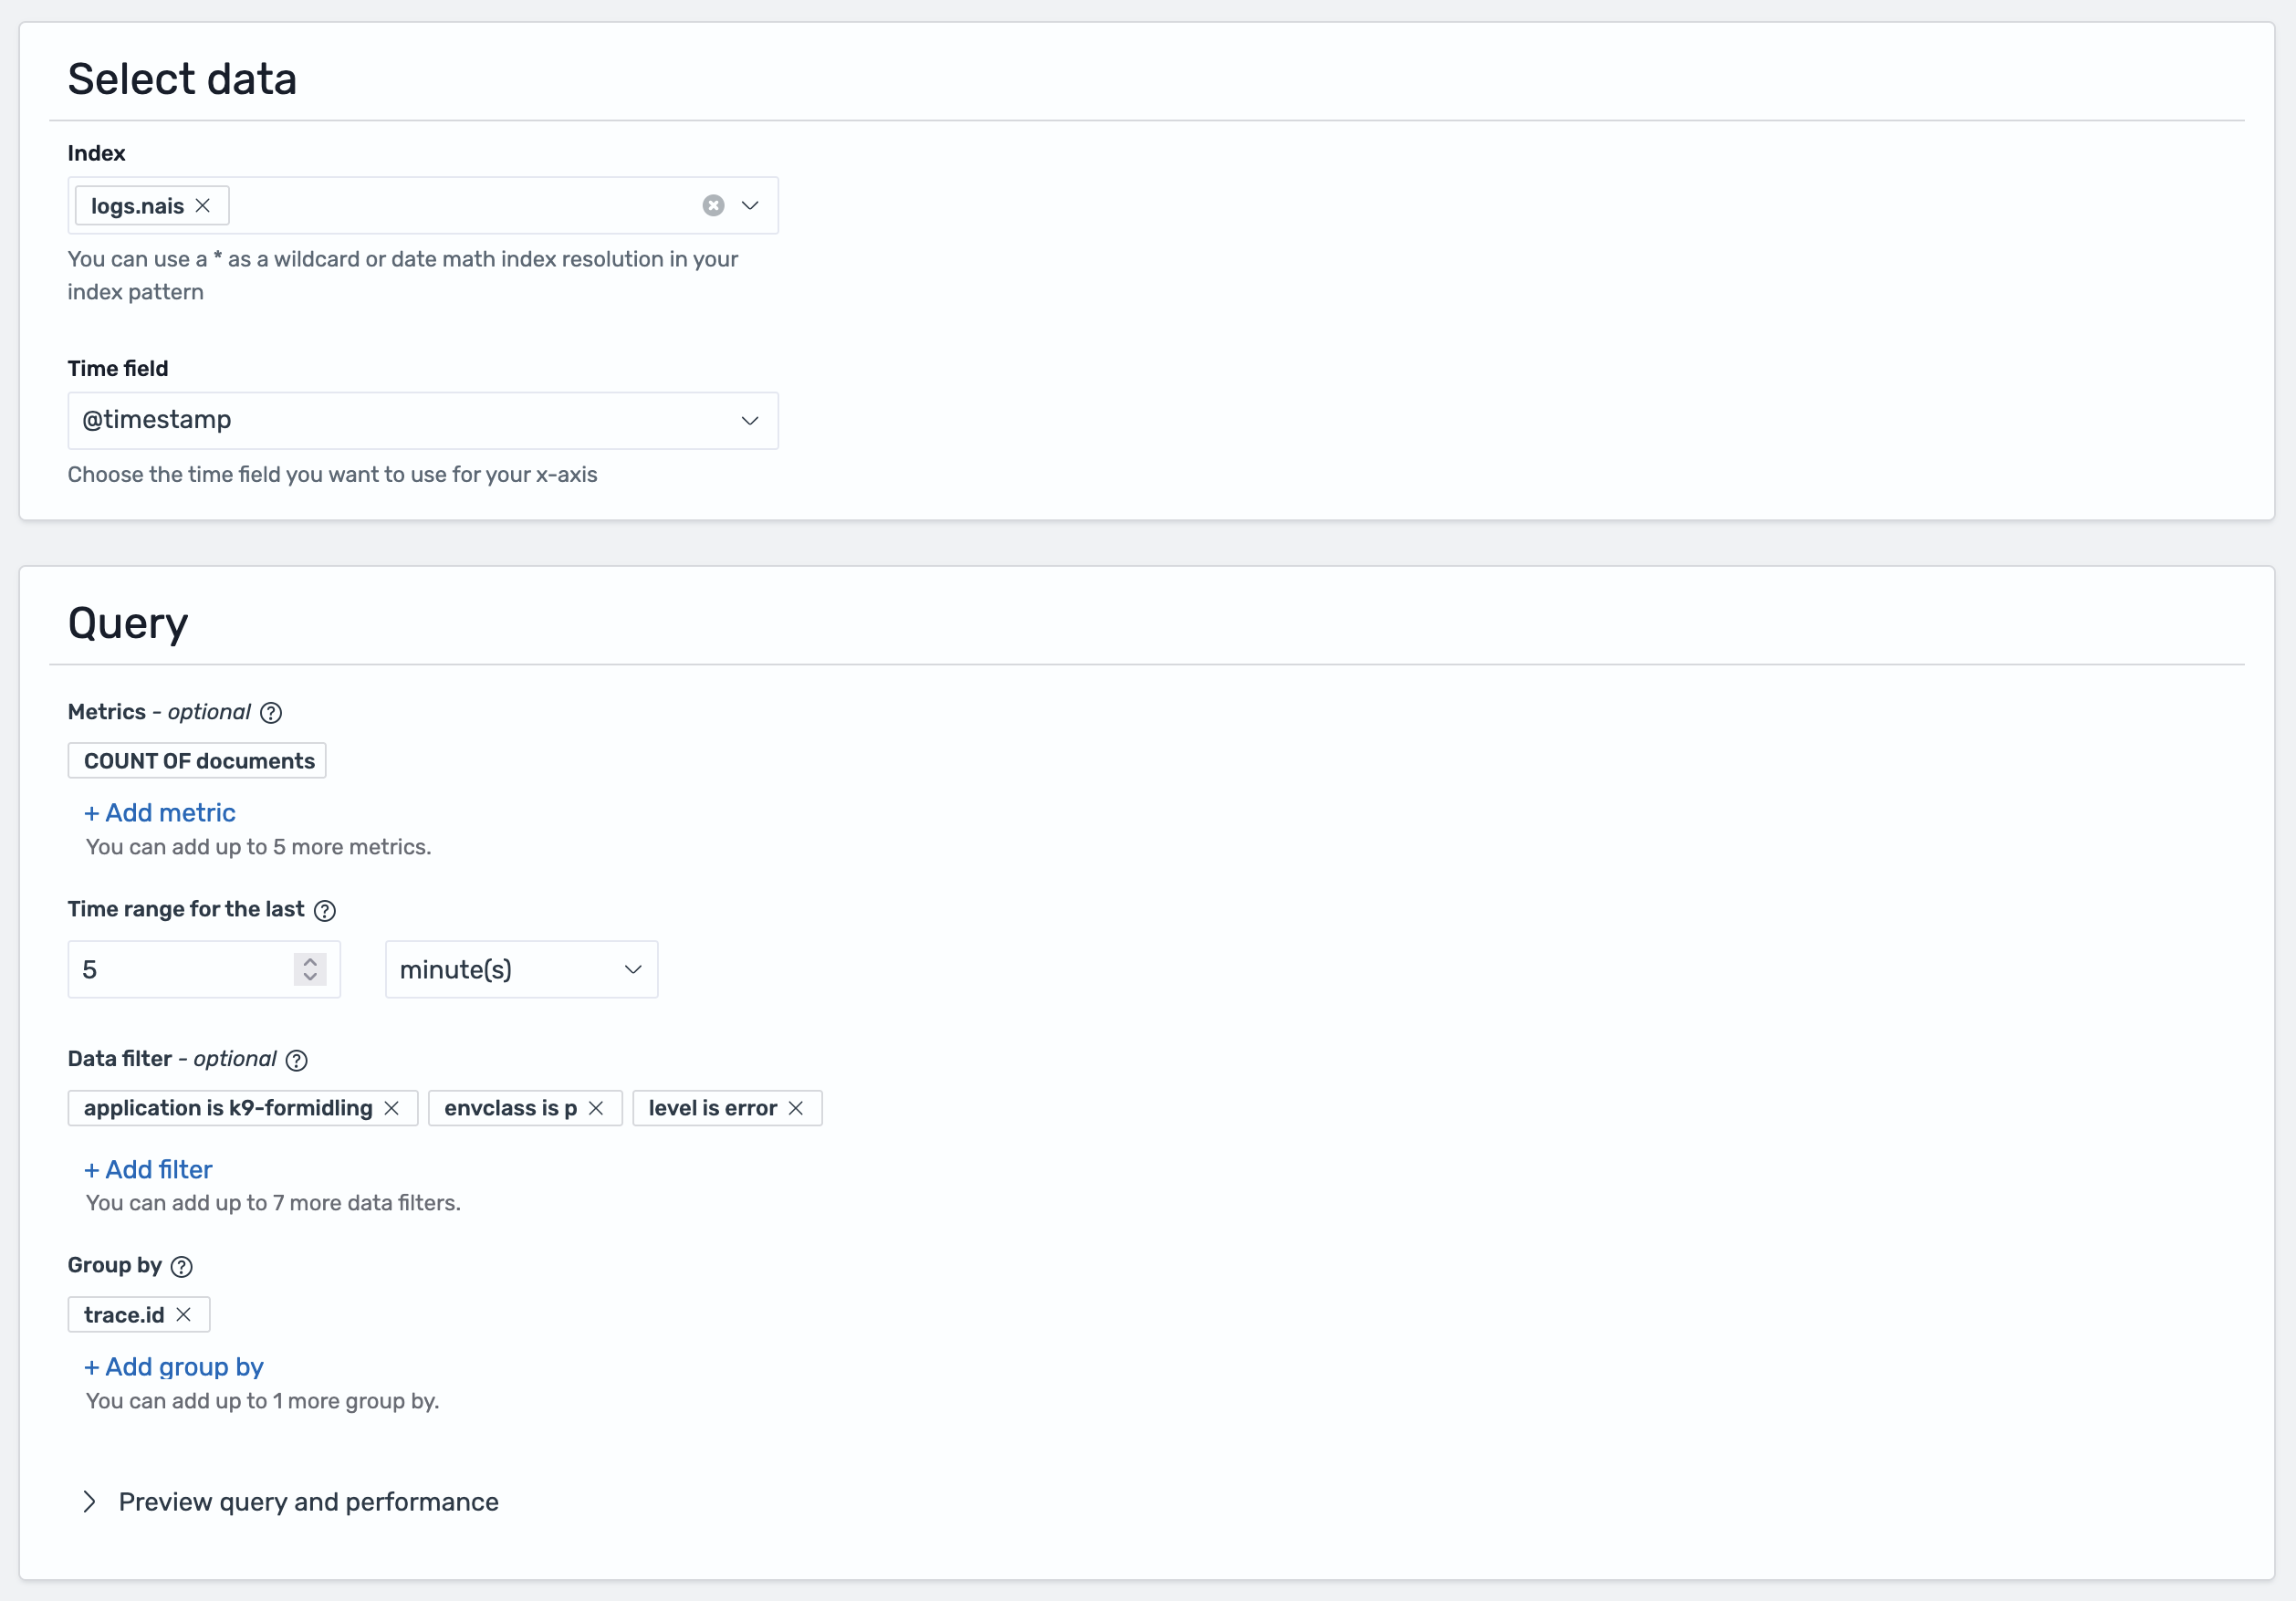
Method 2: Extraction query editor 
For more complex queries, you can write the query yourself:
- First, test your search in the Discover tab to find what you're looking for
- Click Inspect in the top-right corner of the screen
- Select the Request tab
- Scroll down to find the query being used to show your results
- Copy this query and paste it into the Extraction query editor when creating your monitor
Step 3: Create a trigger 
Triggers define the threshold for when an alert should be sent and specify which notification channel to use.
Add a trigger 
- Click Add trigger
- Trigger name: Describe the condition (e.g., "High error rate")
- Severity level: Select 1-5 (1 is highest priority)
- Trigger condition: Define the threshold for when to alert
Common conditions:
ctx.results[0].hits.total.value > 10    # More than 10 errors
ctx.results[0].hits.total.value > 0     # Any errors found
ctx.results[0].hits.total.value == 0    # No logs found (missing expected events)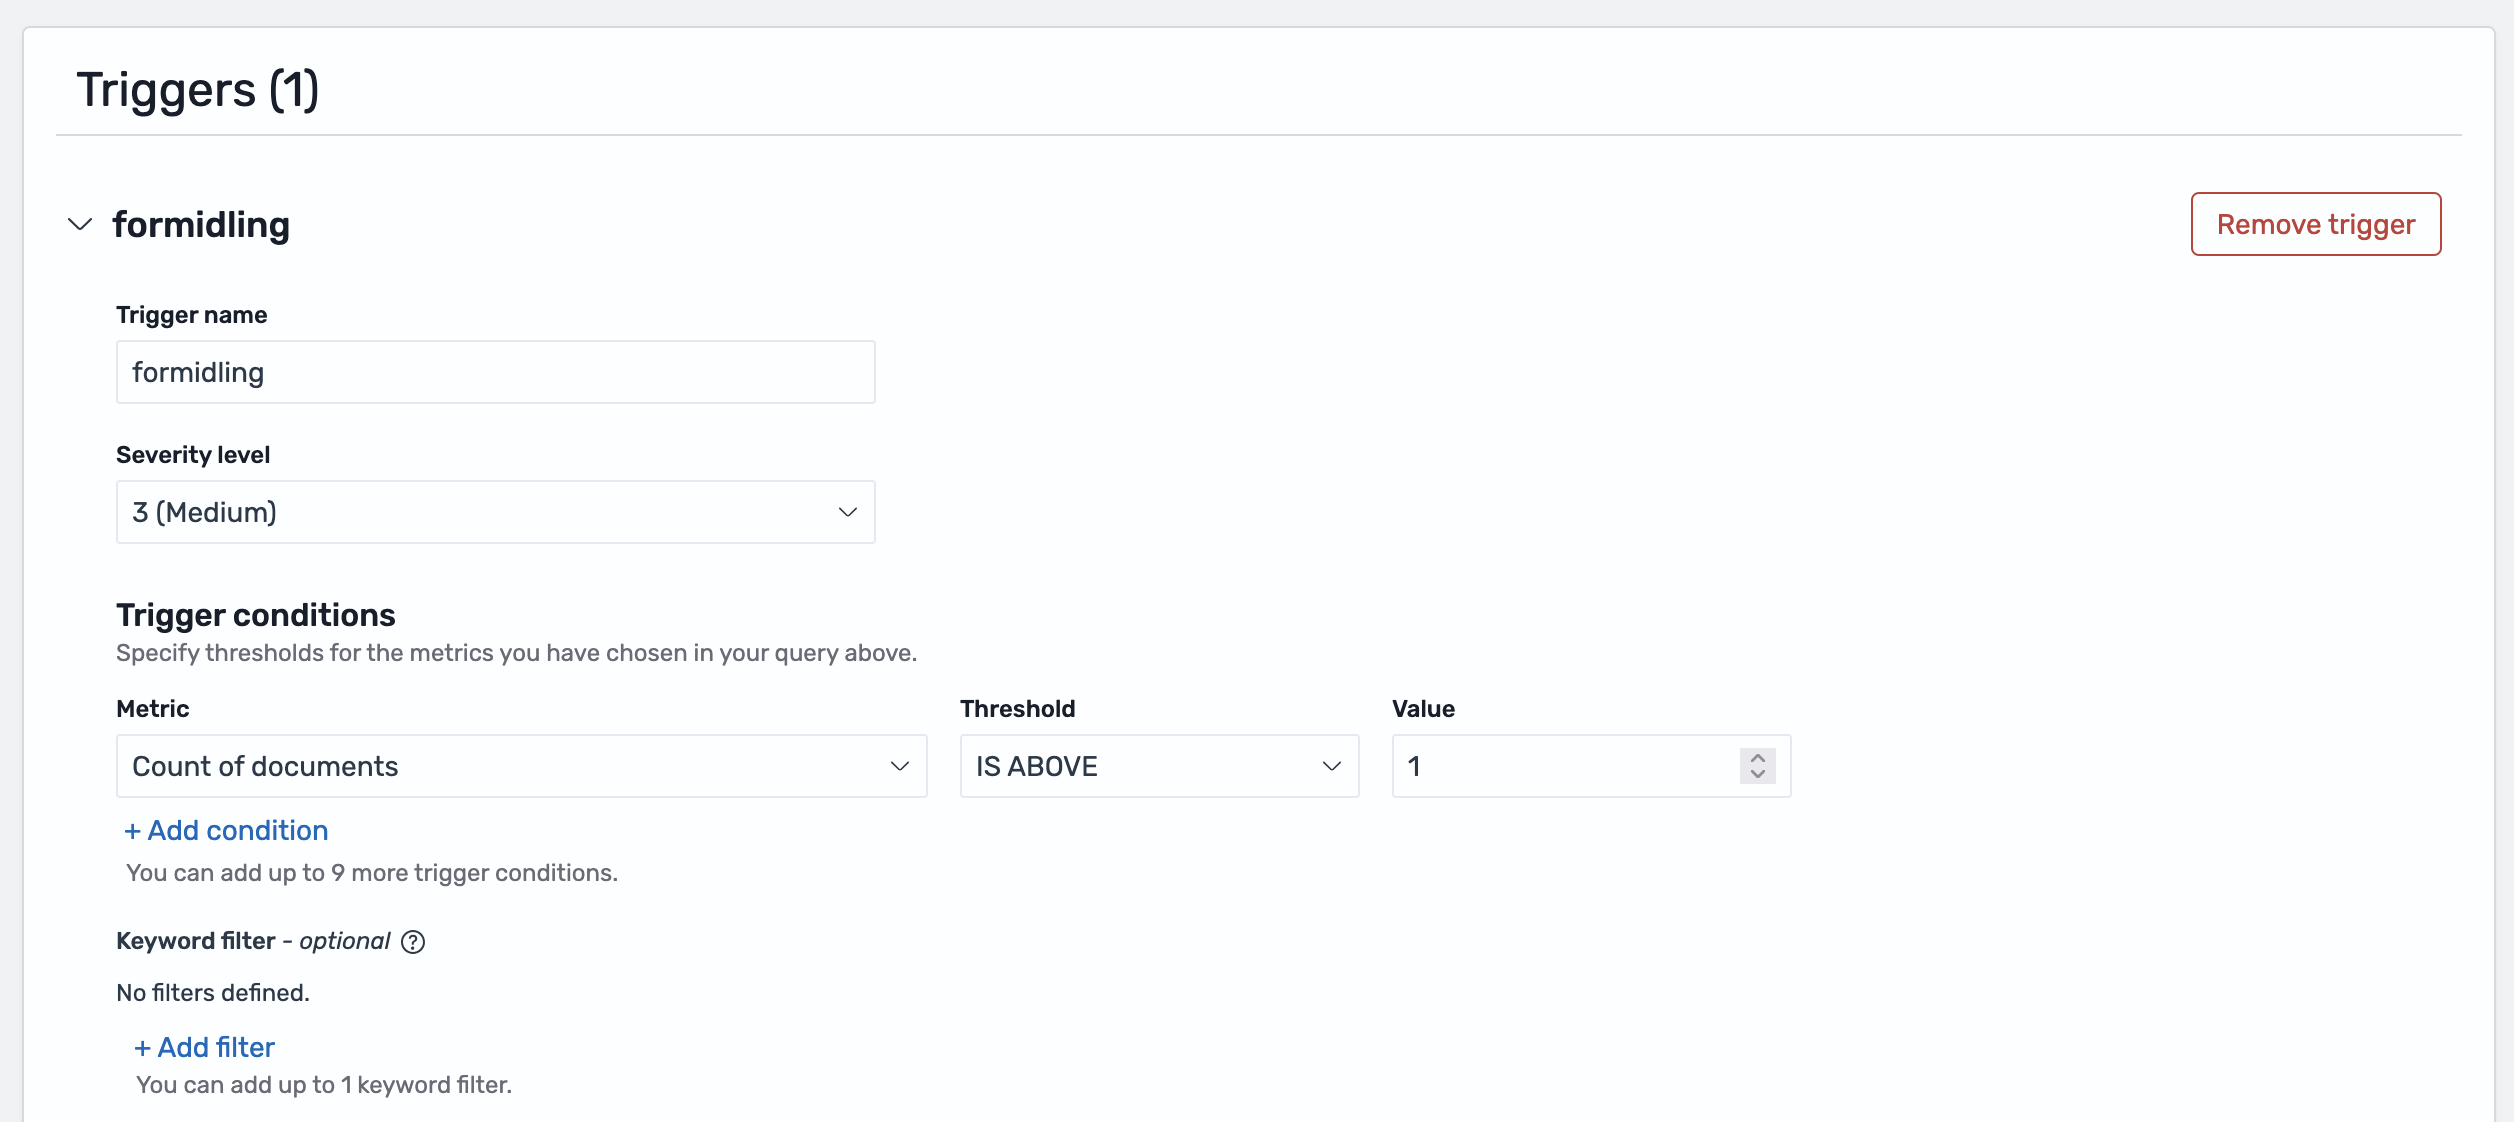
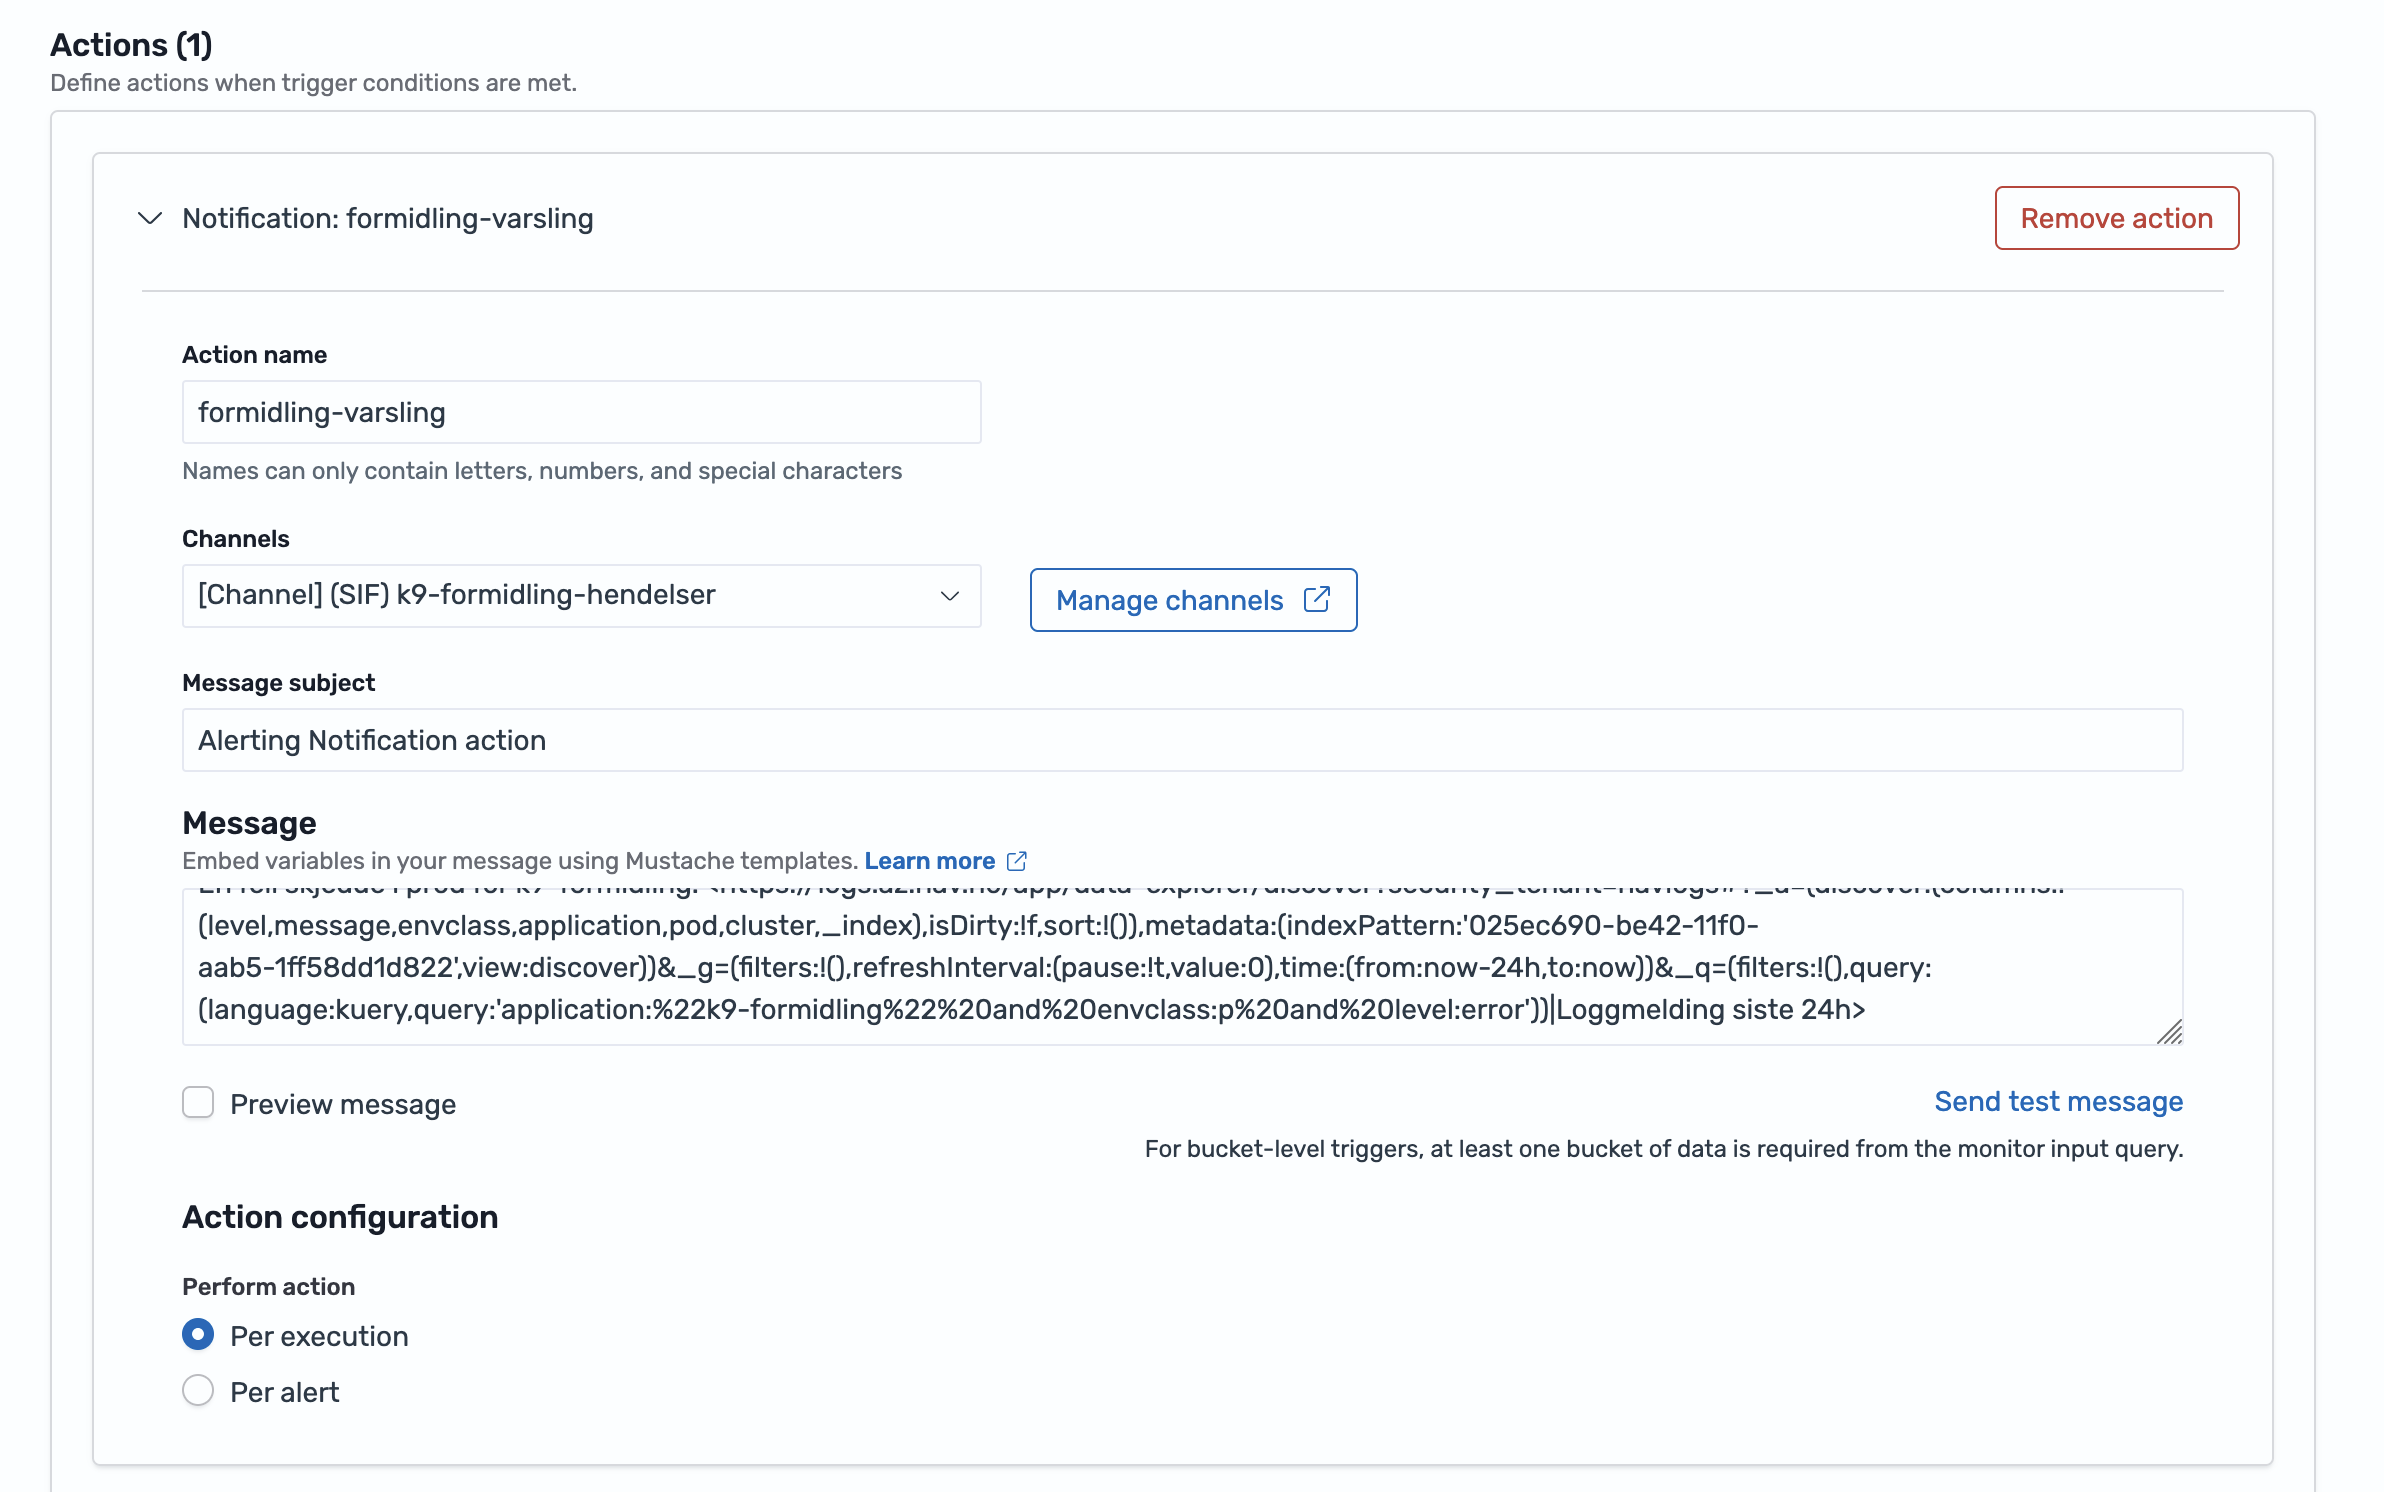
Configure action 
Under the Action section of the trigger, select where the alert should be sent.
- Click Add action
- Action name: e.g., "Notify team Slack"
- Destination: Select your notification channel (created in Step 1)
- Message: Customize the alert content
Example message:
⚠️ Alert: {{ctx.monitor.name}}

Found {{ctx.results.0.hits.total.value}} errors
Time: {{ctx.periodStart}} to {{ctx.periodEnd}}

View logs: https://logs.az.nav.no
Useful variables:
{{ctx.monitor.name}}- Monitor name{{ctx.trigger.name}}- Trigger name{{ctx.results.0.hits.total.value}}- Number of matches{{ctx.periodStart}}/{{ctx.periodEnd}}- Time period
Enable throttling (optional) 
To prevent alert spam:
- Throttling: Enable and set time window (e.g., 10 minutes)
- This limits how often notifications are sent
Save 
Click Create to save your monitor. It will start running on the schedule you defined.
Complete example 
Here's a quick example monitoring for missing accounting reports:
Notification channel:
- Name:
bo-team-slack - Type: Slack
Monitor:
- Name:
BO accounting reporting - Type: Per query monitor
- Schedule: Every 5 minutes
- Index:
logs.nais - Time field:
@timestamp - Query:
application: "bo-accounting" AND message: "accounting report sent"
Trigger:
- Name:
BO does not send accounting - Condition:
ctx.results[0].hits.total.value == 0(alerts when no logs found) - Action: Send to
bo-team-slack
Troubleshooting 
Monitor not triggering:
- Test your query in Discover first
- Check the time range covers when logs appear
- Verify the trigger condition is correct
No notifications received:
- Test the notification channel with "Send test message"
- Check the channel is selected in the action
- Verify throttling isn't blocking notifications
Too many alerts:
- Increase the trigger threshold
- Enable throttling to limit notification frequency
- Make your query more specific
Related documentation 
- Get started with nav-logs
- DQL Reference
- Loki alerts (recommended alternative)
- OpenSearch Alerting documentation